Abstract
This study looks at how reliable Haramaya University's electricity distribution system is and offers ways to make it better. The main causes of the current system's severe reliability problems are overload, tree contact, wind, aged poles and equipment, cable failure, and poor maintenance and operation practices. In this study, six cases were simulated using ETAP 19.0.1 software to represent Haramaya University's current and future distribution systems. The reliability indicators of the current system are under Ethiopian standards, according to the results. In Case 5 (underground ring distribution network), the reliability indices improved significantly with shorter interruption durations, less interruptions per customer per year, and an increased availability index. Ethiopian Electric Utility (EEU) lost an estimated 2,585,743.99 Ethiopian Birr (ETB) in revenue as a result of power outages. In Case 5, Haramaya University (HU) could save 5,762,746.38 ETB annually and the utility could save 2,239,549.9 ETB annually. To increase distribution system reliability, the study recommends converting an overhead radial network to an underground ring network, integrating solar distributed generators, and placing fuses and reclosers in distribution lines. Another way to increase reliability until the underground ring distribution system is finished is to replace outdated equipment and cut trees.
Keywords
Reliability, Protection Device, Network Reconfiguration, Distributed Generation
1. Introduction
The electric power system consists of electrical constituents that are employed to supply, transmit, and use electric power. Providing a reliable and cost-effective network for the transfer of electricity from generating stations to consumer locations is the primary goal of power systems
| [1] | Ayodeji A. Akintola, Claudius Ojo A. Awosope, “Reliability Analysis of Secondary Distribution System in Nigeria: A Case Study of Ayetoro 1”, International Journal of Engineering and Science (IJES), 6(7): 13-21, 2017. https://doi.org/10.9790/1813-0607011321 |
[1]
. Electricity is delivered to consumers by the distribution system from the substations. Electric utilities' responsibility is to supply customers with uninterrupted and reliable electricity. However, it is the most challenging problem for electric power utilities. The reliability problems in electric power systems usually occur in distribution systems as a result of the complexity of the networks
| [2] | Abrha H. and Teshome G., “Reliability Assessment of Electrical Distribution Network using Analytical Method: A Case Study of Maychew City Distribution System”, International Journal of Engineering Research & Technology (IJERT), 9(08): 977-985, 2020. |
[2]
.
The utility must constantly develop and improve the system's reliability based on consumer needs in order to reach an acceptable standard of quality, safety, and reliability at a reasonable cost. This can be achieved by assessing and evaluating the reliability, performance, and quality of electric power distribution networks
| [3] | Anteneh D., “Reliability Assessment of Distribution System Using Analytical Method: A Case Study of Debre Berhan Distribution Network”, Journal of Informatics Electrical and Electronics Engineering, 1(1): 1-9, 2020. https://doi.org/10.54060/JIEEE/001.01.002 |
[3]
.
An essential component of the distribution network operation and planning is assessment of power supply reliability. Reliability assessment methods allow the evaluation of the reliability of systems. Two popular techniques for assessing a distribution system's reliability are historical and predictive assessment. The techniques offer crucial details on how to enhance a system's lifespan in order minimize safety hazards and risks
| [3] | Anteneh D., “Reliability Assessment of Distribution System Using Analytical Method: A Case Study of Debre Berhan Distribution Network”, Journal of Informatics Electrical and Electronics Engineering, 1(1): 1-9, 2020. https://doi.org/10.54060/JIEEE/001.01.002 |
[3]
. Historical reliability assessment is used to evaluate the past performance of the system based on past real data. System Average Interruption Frequency Index (SAIFI), System Average Interruption Duration Index (SAIDI), Customer Average Interruption Duration Index (CAIDI), and Average Service Availability Index (ASAI), are commonly used reliability indices to measure performance of the distribution system. Most electric power utilities gather past system data and display the performance of system operation
| [4] | M. Wadi, M. Baysal, A. Shobole, and M. R. Tur, “Historical and Monte Carlo Simulation-Based Reliability Assessment of Power Distribution Systems”, Sigma Journal of Engineering and Natural Sciences, 38(3): 1527-1540, 2020. |
[4]
.
Based on system topology and component reliability data, a predictive reliability assessment may forecast a distribution system's interruption profile. It can also be used to determine the appropriate improvement strategies to increase system dependability
| [5] | Sultan, R. A. Swief and M. M. Mostafa, “Optimal DG Placement in a Radial Distribution Network for Reliability Improvement”, Journal of Al Azhar University Engineering Sector, 12(45): 1351-1358, 2017. |
[5]
. The two fundamental techniques for evaluating predictive reliability are analytical and simulation.
Analytical methods use a mathematical model to represent the system and use direct numerical solutions to assess the model's reliability indices. Additionally, two categories of analytical techniques can be distinguished: Markov modeling and network modeling
| [4] | M. Wadi, M. Baysal, A. Shobole, and M. R. Tur, “Historical and Monte Carlo Simulation-Based Reliability Assessment of Power Distribution Systems”, Sigma Journal of Engineering and Natural Sciences, 38(3): 1527-1540, 2020. |
[4]
.
The Monte-Carlo simulation technique simulates the real process and the random behavior of the system and its components in order to evaluate the reliability index. The reliability indices' probability distributions and average values can both be obtained using this technique
| [6] | Abdulfeta M., “Reliability Assessment of Distribution System and Improvement by Intelligent Placement of Distributed Generation (DG): Case Study of Gonder City Power Distribution System” Master’s Thesis, Bahir Dar University, Bahir Dar, Ethiopia, 2020. |
[6]
. Nodaway, with the development of computers, the analytical graph method becomes the main method of calculating reliability in power system computing software; ETAP, PSS-Adept, and CYMDIST-Reliability Assessment
| [7] | Huynh Tien Dat, Nguyen Thi Bich, Nguyen Ngoc Phuc and Le Quang Binh, “Distribution Network Reliability Assessment by ETAP Software”, Greater Mekong Subregion Academic and Research Network (MSARN) International Journal, 16: 33-46, 2022. |
[7]
. The common reliability indicators are used in both analytical and simulation methods to assess a distribution network's reliability.
Since electricity is essential to the political, technological, and economic development of any nation, demand for it has risen. Power outages are a major issue in Ethiopia, where the Ethiopian Electric Utility is responsible for providing customers with reliable electric power
| [3] | Anteneh D., “Reliability Assessment of Distribution System Using Analytical Method: A Case Study of Debre Berhan Distribution Network”, Journal of Informatics Electrical and Electronics Engineering, 1(1): 1-9, 2020. https://doi.org/10.54060/JIEEE/001.01.002 |
[3]
. Specifically, Haramaya university distribution usually experiencing power interruptions due to short circuit, earth fault and operational. This may cause reliability problems of distribution system. These problems have to be solved to satisfy customers’ demand and utilities’ benefits.
This study's primary goal is to assess the Haramaya University power distribution system's reliability using reliability indices and suggest ways to make it more reliable.
The specific objectives of the study are:
1. To find the major causes of power outage of the existing Haramaya University power distribution system.
2. To model and simulate the existing and under construction Haramaya University distribution system reliability in ETAP software.
3. To compare the existing and under construction Haramaya University distribution system using reliability indices.
4. To propose the improvement technique.
5. To perform cost analysis.
The purposes of this study are to:
1. Find the causes of power outage in Haramaya University power distribution system,
2. Show the impact of power outages on consumers' and utilities' economies.
3. Monitor and maintain DS performance within the standards of the country,
4. Provide information to utilities and customers for reliability improvement options.
5. Allow customers to get quality and reliable electric power supply.
2. Reliability of Power System
Reliability is the probability that a system or its parts will carry out their designated function for a predetermined amount of time. Continuously providing customers with high-quality electricity is referred to as the power system's reliability
| [3] | Anteneh D., “Reliability Assessment of Distribution System Using Analytical Method: A Case Study of Debre Berhan Distribution Network”, Journal of Informatics Electrical and Electronics Engineering, 1(1): 1-9, 2020. https://doi.org/10.54060/JIEEE/001.01.002 |
[3]
. The security and adequacy of a power system can be used to indicate its reliability. The power system's ability to react to disruptions and instabilities that occur within the system is known as system security. When there are sufficient facilities in the power system to meet the demands of the consumer load, the system is said to be adequate. These include the facilities associated with the generation stations, transmission and distribution systems which are required to generate and deliver sufficient electric power to the load points
| [8] | Hamza A. “Assessment of Electric Power Distribution Feeder Reliability: Case Study of Adama City Feeders Before and After Rehabilitation” Master’s Thesis, Adama Science and Technology University, Adama, Ethiopia, 2020. |
[8]
. The reliability assessment can be conducted at generation, composite generation and transmission, distribution system, and substations
| [1] | Ayodeji A. Akintola, Claudius Ojo A. Awosope, “Reliability Analysis of Secondary Distribution System in Nigeria: A Case Study of Ayetoro 1”, International Journal of Engineering and Science (IJES), 6(7): 13-21, 2017. https://doi.org/10.9790/1813-0607011321 |
[1]
.
The following is a discussion of the fundamental parameters used in the distribution system reliability analysis
| [8] | Hamza A. “Assessment of Electric Power Distribution Feeder Reliability: Case Study of Adama City Feeders Before and After Rehabilitation” Master’s Thesis, Adama Science and Technology University, Adama, Ethiopia, 2020. |
[8]
.
The failure rate (λ): is the chance of a part or system experiencing a malfunction at time (t).
Mean Time to Repair (MTTR): is calculated by dividing the total number of repairs by the total time spent on all corrective or preventive maintenance repairs. It is the amount of time (in hours) needed to fix a malfunctioning component and/or get the system back to normal operation.
(1)
Expected Repair Rate (µ): is the frequency of repair (occurrence per year).
Mean Time to Failure (MTTF): It is the estimated time that the component will be in failure state and can be calculated as the inverse of the failure rate (λ) for constant fail systems.
Mean Time between Failures (MTBF): is the expected amount of years between failures of component, which is a fundamental indicator of reliability for repairable equipment. When a failure rate is constant, MTBF is the amount of time that passes before a part or system assembly malfunctions.
Forced Outage Rate (FOR): is the chance of discovering a forced outage component at a future point in time. It is equivalent to the typical outage duration per year.
Many researches were conducted on the reliability assessment of distribution network using either analytical or simulation methods. All studies indicate that reliability assessment is very essential for the design and operation of electrical power systems. In this paper, some selected papers, which are conducted as reliability assessment of distribution system, were reviewed as shown in
Table 1 below. The review in this paper is concentrated on the techniques/methods used, work explanation, and research gaps.
Table 1. Review of Related Works.
Authors | Method | Work explanation | Research gaps |
| [9] | Shaoyun Ge, Li Xu, Hong Liu, Mingxin Zhao, "Reliability Assessment of Active Distribution System Using Monte Carlo Simulation Method", Journal of Applied Mathematics, vol. 2014, Article ID 421347, 10 pages, 2014. |
[9] | Monte-Carlo Simulation | It was discovered that the active distribution system's low and high DG penetration levels presented a reliability assessment challenge. | This work is only limited to the effect of DG penetration on reliability indices (SAIDI and EENS). |
| [1] | Ayodeji A. Akintola, Claudius Ojo A. Awosope, “Reliability Analysis of Secondary Distribution System in Nigeria: A Case Study of Ayetoro 1”, International Journal of Engineering and Science (IJES), 6(7): 13-21, 2017. https://doi.org/10.9790/1813-0607011321 |
[1] | analytical method and network reduction technique, | The system reliability indices were calculated from the substation interruption data. | The effect of inadequate generation and the impact of transmission subsystem failure were not considered. |
| [10] | Khaidir A, Rama O, and Ramadoni S, “Reliability Analysis of Power Distribution System”, Journal of Electrical Technology UMY (JET-UMY), 1(2), 2017. |
[10] | Monte-Carlo Simulation | Reliability indices were evaluated for feeders and their load points. | ASAI, ASUI, EENS, and cost worth were not calculated |
| [5] | Sultan, R. A. Swief and M. M. Mostafa, “Optimal DG Placement in a Radial Distribution Network for Reliability Improvement”, Journal of Al Azhar University Engineering Sector, 12(45): 1351-1358, 2017. |
[5] | Grey Wolf optimization technique | Reliability indices EENS, SAIFI, and SAIDI were solved by strategically placing distributed generators in radial feeders for improving reliability of the system. | This work is only focused on the placement of DG unit, the major causes of power outages and other improvement techniques were not studied |
| [11] | S. L. Braide and E. O. Kenneth, “Improved Reliability Analysis of Electricity Power Supply to Port Harcourt Distribution Network”, International Journal of Engineering Science Invention, 7(7): 2319–6734, 2018, https://doi.org/10.15662/ijareeie.2022.1105001 |
[11] | Analytical | System reliability indices, load point and cost worth indices were evaluated in ETAP software | The study was limited to analyzing current reliability performance. |
| [12] | Dikio C. Idoniboyeobu, Biobele A. Wokoma and Noble C. Adiele, “Improvement of Electrical Power Reliability for Afam Community in Rivers State, Nigeria”, American Journal of Engineering Research (AJER), 7(5): 162-167, 2018. |
[12] | Analytical and simulation | Reliability indices were evaluated for feeders and their load points. Static VAR Compensator was integrated to the distribution system to increase its reliability. | The causes of power outage and other possible reliability improvement techniques were not included in the study. |
| [13] | Balogun M. O., Ahmed M. O., Ajani A. A., and Olaoye H., “Reliability Assessment of 33 KV Feeder: A Case Study of Transmission Company of Nigeria, Ganmo Work Centre” World Journal of Innovative Research, 6(1): 77-83, 2019. Available online at: https://www.wjir.org/download_data/WJIR0601016.pdf |
[13] | Maintenance strategies | Availability, reliability and maintainability were evaluated using outage data | The root causes of outage, mitigation technique were not studied |
| [14] | Ghiasi M., Ghadimi N. and E. Ahmadinia, “An analytical methodology for reliability assessment and failure analysis in distributed power system”, Springer Nature Applied Sciences Journal, 1(44), 2018, https://doi.org/10.1007/s42452-018-0049-0 |
[14] | Analytical | The results of the simulation using ETAP show the efficacy and usefulness of reliability evaluation. | The distribution system should be reconfigured to get improved reliability performance |
| [15] | Kabi Raj Puri, Ash Bahadur Subba, Kezang Pelden, and Roshan Chhetri, “Reliability Assessment of Distribution System through Cost Analysis”, International Journal of Scientific Research and Engineering Development, 3(4): 560-565, 2020. |
[15] | Analytical (FMEA) | The optimum placement of automatic switches was determined by economic analysis to see the impacts on reliability enhancement | The reliability indices other than SAIFI and SAIDI were not calculated |
| [3] | Anteneh D., “Reliability Assessment of Distribution System Using Analytical Method: A Case Study of Debre Berhan Distribution Network”, Journal of Informatics Electrical and Electronics Engineering, 1(1): 1-9, 2020. https://doi.org/10.54060/JIEEE/001.01.002 |
[3] | Analytical | System reliability indices were evaluated | Improvement solution and interruption cost were not studied |
| [2] | Abrha H. and Teshome G., “Reliability Assessment of Electrical Distribution Network using Analytical Method: A Case Study of Maychew City Distribution System”, International Journal of Engineering Research & Technology (IJERT), 9(08): 977-985, 2020. |
[2] | Analytical | The distribution system's reliability indices were computed and compared to international standards. | The distribution system should be reconfigured; but the authors did not include the improvement solution |
Generally, all authors indicate that reliability assessment is very essential for the planning and operation of electrical systems. Numerous studies on distribution networks reliability evaluation have been carried out using simulation or analytical techniques. But there is a gap in studying the main causes of poor reliability. And, nobody conducts the reliability assessment of Haramaya University’s distribution system. So, considering these gaps, this paper work conducts the reliability assessment of Haramaya University’s power distribution network using analytical method in ETAP software and proposes an appropriate solution.
3. Materials and Methods
3.1. Description of Study Location
Haramaya University is found in Eastern Hararghe Zone of the Oromia Region about 500.2 km from Addis Ababa and 10 km west of Harar city on the road to Dire Dawa. Haramaya University has a latitude and longitude of 9°24’N 42°01’E’ with an altitude of 2047 m above sea level.
3.2. Haramaya Substation
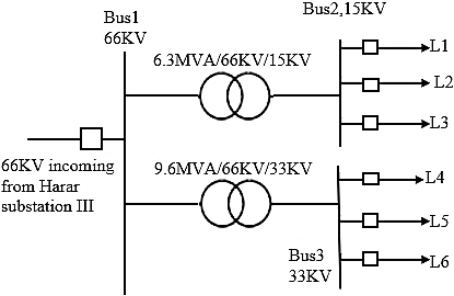
Haramaya substation is receiving 66 kv from Harar substation III and supplies the electricity to Haramaya city, Haramaya University, and the neighboring areas. The distribution substation has six outgoing feeders. These feeders are Bate-finkile (L1), Haramaya University (L2), Haramaya city (L3), Haqa (L4), Grawa (L5) and Harar water (L6).
Figure 1. Single-line diagram of Haramaya Distribution Substation.
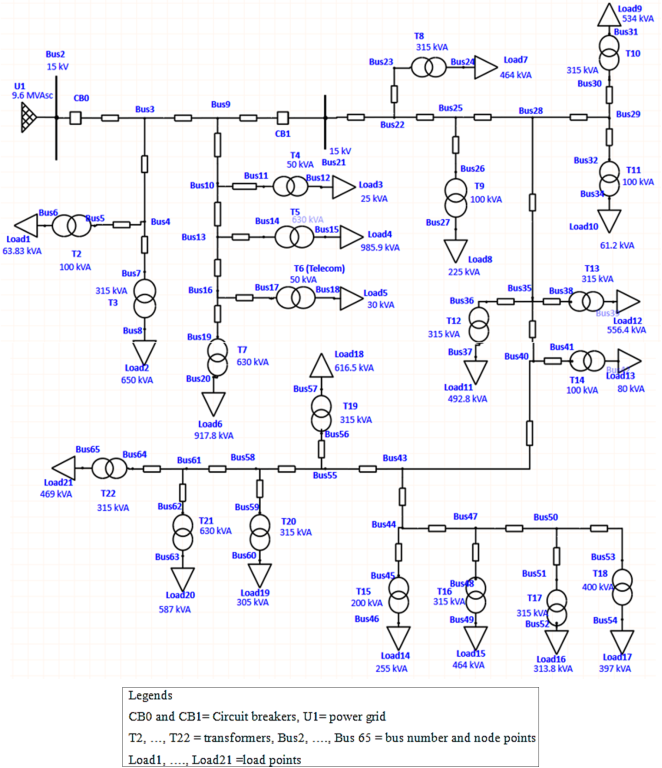
Figure 2. Single-line diagram of Haramaya University power distribution system.
3.3. Reliability Indices
Usually, common reliability indices are used to evaluate a distribution system's reliability. The following equations are used to calculate the load point indices, and they provide the system's average failure rate, outage duration, and yearly outage duration.
Customer-centered and load or energy-centered indices are among the indices used in reliability analysis of distribution system
| [16] | IEEE Guide for Electric Power Distribution Reliability Indices," in IEEE Std 1366-2012 (Revision of IEEE Std 1366-2003), vol., no., pp. 1-43, 31 May 2012, |
[16]
.
A. Customer-centered indices
1. System Average Interruption Frequency Index (SAIFI): This measure shows how many customers experienced sustained interruptions over a predetermined period of time, usually one year, or it shows the average amount of sustained interruptions experienced by a customer in a particular period of time.
=(9)
Where Ni is the number of interrupted customers at load point i, Nt is the total number of customers supplied in the region, and λi is the failure rate.
2. System Average Interruption Duration Index (SAIDI): it measures the average amount of time of interruptions for each client. It shows how frequently a client has an interruption on average during a one-year period. Customer minutes or customer hours of interruption per year are typically used to describe it.
=(10)
Where ri represents each interruption's restoring period.
3. Customer Average Interruption Duration Index (CAIDI): This measure, which indicates the amount of time needed to resume the system interruption, is the average interruption duration for those customers who had an interruption over a period of a year. It shows how long it typically takes to get customers' service back after a prolonged outage.
=(11)
4. Customer Average Interruption Frequency Index (CAIFI): For consumers who experience interruptions, it provides the average frequency of prolonged interruptions.
=(12)
Where, Cn represents all of the consumers that were interrupted.
5. Average Service Availability Index (ASAI): It shows the proportion of a year or the specified reporting period that an end user has electricity supplied. Higher reliability is shown in higher ASAI values.
=(13)
Where 8760 is the total number of hours in a year.
6. Average Service Unavailability Index (ASUI): It represents the average service availability index's (ASAI) complementing value.
B. Load or energy-orientated indices
1. Expected Energy Not Supplied Index (EENS): It stands for the entire amount of energy that the system is unable to provide. and expressed in either watt-hours or KWh.
Where, Ed(i) represents the total energy demanded during the time of interest t, Lf(i) represents the load factor, and Lp (i) represents the peak load demand.
2. Average Energy Not Supplied (AENS): It represents the average energy not supplied by the system.
(17)
3. Average Customer Curtailment Index (ACCI): It stands for the total amount of energy that the system is unable to supply to each impacted customer by the system.
(18)
3.4. Reliability Assessment in ETAP
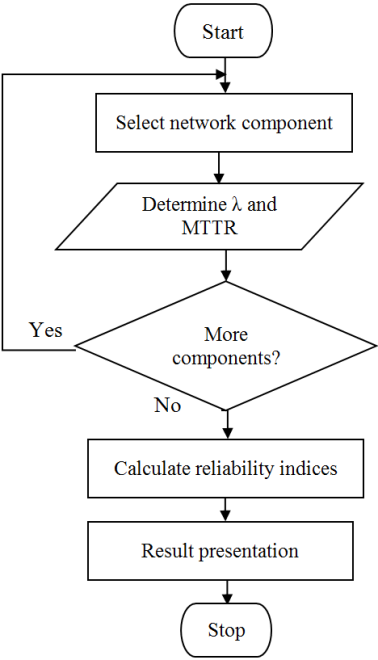
For the design, modeling, analysis, and real-time operation of electrical power systems, electrical engineers utilize the Electrical Transient Analyzer Program (ETAP), a fully graphical electrical power system analysis tool. For radial and looping systems, the reliability analysis employing ETAP provides an effective analytical technique to support the distribution reliability level. Each component's failure rate and mean time to repair must be determined in order to assess reliability using ETAP
| [17] | E-TAP, “E-TAP user Guidelines”, South California: Operation Technology, Inc, 2016. |
[17]
.
Figure 3. ETAP algorithm for reliability indices calculation.
3.5. Power Interruption Cost Evaluation
Customers and the utility may suffer financial losses as a result of power interruptions. The number of consumers that encounter interruptions has a significant impact on the amount of money lost as a result. Customers' information, interruption statistics, and electricity tariffs are used by the company to estimate the costs of power interruptions
| [18] | Eyasu B, “Studies on Power Distribution System Reliability Assessment and improvement”, Master’s thesis, Addis Ababa Science and Technology University, Addis Ababa, Ethiopia, 2017. |
[18]
. In this research paper both utility and customer’s interruption cost have been estimated. The amount of loss experienced by the end user during power interruption is known as the customer cost of reliability. These costs might be classified as either intangible or tangible. Because of intangible costs, it is challenging to estimate the cost of interruption from the customer's perspective
| [19] | Getinet U., “Reliability Assessment and its Improvement of Power Distribution systems: Case Study of Dire Dawa Substation I”, Master’s thesis, Adama Science and Technology University, Adama, Ethiopia, 2020. |
[19]
. However, in this paper, the cost of alternative supply during grid power interruption has been used to estimate the customer cost of interruption.
4. Results and Discussions
Under this section the reliability indices of Haramaya University distribution system in different case studies and economic analysis of proposed cases were presented.
4.1. Base Case: Existing Distribution System
In this case, both ETAP software and manual methods were used to assess the reliability indices of Haramaya University's current grid power distribution system.
Table 2. Comparison between ETAP and manual reliability indices calculation results.
Reliability indices | ETAP | Manual |
SAIFI (f / customer.yr) | 196.38 | 198.15 |
SAIDI (hr / customer.yr) | 277.78 | 275.39 |
CAIDI (hr / customer.int) | 1.41 | 1.4 |
ASAI (%) | 96.83 | 96.86 |
ASUI (%) | 3.17 | 3.14 |
EENS (MWh)/yr | 2186.57 | 2167.43 |
AENS (MWh/customer.yr) | 104.12 | 103.21 |
The above results show that ETAP Software calculation results are almost similar to the manual calculation results. The values of reliability indices are too far from Ethiopia's standards as well as international countries' standards. This shows that the existing HU power distribution system has serious reliability problems.
4.2. Case 1: Existing Distribution System with Backup Generators
In this case, the diesel generators have been connected to sensitive loads in the university.
Table 3. Simulation results for Case 1.
Reliability indices | Values |
SAIFI (f / customer.yr) | 196.5030 |
SAIDI (hr / customer.yr) | 191.9782 |
CAIDI (hr / customer.int) | 0.977 |
ASAI (%) | 97.81 |
ASUI (%) | 2.19 |
EENS (MWh)/yr | 1509.20 |
AENS (MWh/customer.yr) | 71.87 |
The above results show that the impact of diesel generators on system’s reliability. Backup generators have no effect on the frequency of interruptions, but other reliability indices were changed. ASAI (%) increased from 96.83% to 97.81%, while EENS decreased from 2186.572 MWhr/yr to 1509.199 MWhr/yr. The estimated cost of unsupplied energy of 2,585,743.99ETB/year has been lost by Ethiopian Electric Utility and 1,688,046.05ETB to 5,961837.61 ETB (Ethiopian birr) per year has been lost by Haramaya University from two years data.
4.3. Case 2: Reconfiguration of Existing System with Dropout Fuses and One Recloser
In this study case, the fuses have been installed between the primary feeder and each transformer, and a single recloser has been placed on the line by considering a line with sensitive loads, like classrooms, library, laboratories, cafeteria, and offices, are supplied through this line.
Table 4. Simulation results for Case 2.
Reliability indices | Values |
SAIFI (f / customer.yr) | 176.79 |
SAIDI (hr / customer.yr) | 123.57 |
CAIDI (hr / customer.int) | 0.70 |
ASAI (%) | 98.59 |
ASUI (%) | 1.41 |
EENS (MWh)/yr | 981.42 |
AENS (MWh/customer.yr) | 46.73 |
Results in
Table 4 show the impact of inserting fuses and one recloser in the existing HU distribution system on system’s reliability. As it is seen from the results, a recloser on a line with dropout fuses improves the reliability of the existing system. In this case, SAIFI is reduced by 10% and SAIDI is reduced by 41%. EENS is reduced by 40.4% and ASAI (%) is increased from 96.83% to 98.59%. These results are also not close to Ethiopia's benchmark standard, so it needs more reliability improvement.
4.4. Case 3: Reconfiguration of Existing System with Fuses and Two Reclosers
In this case, a single recloser has been placed into Case 2's modeled distribution system by taking into account the feeder's length, customers number, and load sensitivity.
Table 5. Simulation results for Case 3.
Reliability indices | Values |
SAIFI (f / customer.yr) | 168.53 |
SAIDI (hr / customer.yr) | 118.64 |
CAIDI (hr / customer.int) | 0.704 |
ASAI (%) | 98.65 |
ASUI (%) | 1.35 |
EENS (MWh)/yr | 958.81 |
AENS (MWh/customer.yr) | 45.66 |
The results in
Table 5 illustrate the impact of placing the fuses and two reclosers into the existing HU power distribution system on the values of reliability indices. As shown from the table, the two reclosers and dropout fuses together on the lines enhance existing system’s reliability to some extent. In this case, the system average interruption frequency index per year per customer (SAIFI) was reduced from 196.383 f/ customer.yr to 168.5336 f/customer.yr (16% reduction in interruption frequency); the system average interruption duration index per year per customer has been reduced from 277.776 hr/customer.yr to 118.6362 hr/customer.yr (57.5% reduction in interruption duration); and EENS was reduced from 2186.572 MWhr/yr to 958.813 MWhr/yr (56.2% reduction in expected energy not supplied due to outage).
4.5. Case 4: Integrating Solar DG with Existing Distribution System
In this case, the impact of a photovoltaic (PV) power plant with protection devices on reliability improvement has been presented. The Solar DG was connected to the current distribution system by considering the number of customers and keeping the fuses and reclosers as in Case 3 modeled system.
Table 6. Simulation results for Case 4.
Reliability indices | Values |
SAIFI (f / customer.yr) | 80.57 |
SAIDI (hr / customer.yr) | 78.44 |
CAIDI (hr / customer.int) | 0.974 |
ASAI (%) | 99.10 |
ASUI (%) | 0.90 |
EENS (MWh)/yr | 671.33 |
AENS (MWh/customer.yr) | 31.97 |
The results in
Table 6 demonstrate how DG affects the reliability of the current HU distribution system when combined with protective devices (fuses and reclosers). SAIFI is reduced by 60%, SAIDI is reduced by 72%, EENS is reduced by 70%, and ASAI (%) is increased from 96.83% to 99.1% in this case. The results show that the integration of DG incorporating protection devices into the existing network can greatly increase HU distribution system’s reliability.
4.6. Case 5: Underground Ring Power Distribution System
In this case, the underground ring HU DS, which is under construction, was simulated. For simulation, the default values of active failure rate and mean time to repair of the components were inserted in the modeled one-line diagram.
Table 7. Simulation results for Case 5.
Reliability indices | Values |
SAIFI (f / customer.yr) | 1.18 |
SAIDI (hr / customer.yr) | 20.77 |
CAIDI (hr / customer.int) | 17.597 |
ASAI (%) | 99.76 |
ASUI (%) | 0.24 |
EENS (MWh)/yr | 290.19 |
AENS (MWh/customer.yr) | 13.82 |
Table 7 shows that the modeled one-line diagram of HU's new underground ring power distribution system has given improved reliability indices values. It can be seen that SAIFI is reduced from 196.38f/customer.yr to 1.18f/customer.yr; SAIDI is reduced from 277.78hr/customer.yr 20.77 hr/customer, ASAI increased from 96.83% to 99.76%, and EENS decreased from 2186.572MWhr/yr to 290.19MWhr/yr. Because these values are acceptable by Ethiopian standards, it is possible to increase the system's reliability by converting from the current HU overhead radial DS to underground ring DS.
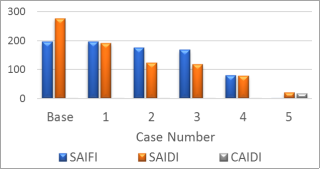
Figure 4. Comparison between Cases instead of SAIFI, SAIDI, and CAIDI.
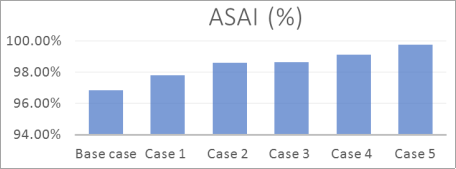
Figure 5. Comparison between Cases instead of ASAI.
As shown in
Figure 4 and
Figure 5, there are serious reliability problems with electric power in the existing Haramaya University distribution network, and the reliability indices have been considerably raised in Case 5 out of all the suggested cases (options) for reliability improvement.
4.7. Economic Analysis of Proposed Cases
Raising the investment cost of a system can improve its reliability.
(19)
Utility side
(21)
Haramaya University side
(22)
(23)
Table 8. Summary of cost analysis of proposed cases.
| Utility side | HU side |
Case number | Revenue saved (ETB/yr) | Payback period (yr) | Money saved (ETB/yr) | Payback period (yr) |
2 | 1414909.9 | 1.11 | 3297306 | 0.48 |
3 | 1141883.7 | 2.05 | 3423349.3 | 0.7 |
4 | 1784847.3 | 34.38 | 4328113.6 | 14.17 |
5 | 2239549.9 | 77.7 | 5762746.4 | 30.2 |
The results in above
Table 8 have been interpreted as follows. Case (2) and (3) are profitable for both utility and University. Case 4 and 5 are profitable only for HU. Therefore to get enhanced reliability indices of distribution network in study area case 4 and 5 are the best options.
5. Conclusions
A reliability assessment of Haramaya University's power distribution system was conducted. The existing system revealed several power interruptions due to factors such as overload, tree contact, wind, pole aging, and equipment failure. The system does not meet the Ethiopian Electric Agency's standards, resulting in an estimated revenue loss of 2,585,743.99 ETB per year. The university has lost 1,688,046.05 to 5,961837.61 ETB/year due to power interruptions in the last two years. Five reliability improvement cases were simulated using ETAP 19.0.1 software, with the fifth case significantly improving the reliability indices to the standard range. Haramaya University can save 5,762,746.38 ETB per year by constructing an underground ring power distribution network. Therefore, Haramaya University is on the right path to improving the reliability of its power distribution system. Future research will focus on power quality issues and mitigation techniques when the DG is connected to the grid. Regular preventive maintenance of distribution lines, including replacing old equipment, installing reclosers, changing overloaded transformers, and trimming trees, is crucial for improving the existing radial distribution system's reliability.
Abbreviations
AAL | All Aluminum Conductor |
ACCI | Average Customer Curtailment Index |
AENS | Average Energy Not Supplied |
ASAI | Average Service Availability Index |
ASUI | Average Service Unavailability Index |
CAIDI | Customer Average Interruption Duration Index |
CAIFI | Customer Average Interruption Frequency Index |
CENS | Cost of Expected Energy Not Supplied |
DG | Distribution Generation |
DS | Distribution System |
ECOST | Expected Interruption Cost |
EENS | Expected Energy Not Supplied |
EEA | Ethiopian Electric Agency |
EELPA | Ethiopian Electric Light and Power Authority |
EEP | Ethiopian Electric Power |
ETAP | Electrical Transient Analyzer Program |
ETB | Ethiopian Birr |
FMEA | Failure Mode and Effect Analysis |
HU | Haramaya University |
IEC | International Electro-technical Commission |
IEEE | Institute of Electrical and Electronics Engineering |
KV | Kilo Volt |
KVA | Kilo Volt Ampere |
KVAR | Kilo Volt Ampere Reactive |
KW | Kilo Watt |
KWh | Kilowatt Hour |
Acknowledgments
This research is supported by the Ministry of Science and Higher Education (MoSHE) and Haramaya University. The authors would also like to thank the technical operators of Haramaya distribution substation and electric utility for providing the required data to conduct this research throughout the process.
Author Contributions
Abdulaziz Adem: Formal Analysis, Investigation, Methodology, Software, Writing – original draft, Writing – review & editing
Ramesh Kumar: Formal Analysis, Supervision
Wehib Abubeker: Project administration, Resources, Supervision
Data Availability Statement
The data used to support the findings of this study are available from the corresponding author upon request.
Conflicts of Interest
The authors declare no conflicts of interest.
References
| [1] |
Ayodeji A. Akintola, Claudius Ojo A. Awosope, “Reliability Analysis of Secondary Distribution System in Nigeria: A Case Study of Ayetoro 1”, International Journal of Engineering and Science (IJES), 6(7): 13-21, 2017.
https://doi.org/10.9790/1813-0607011321
|
| [2] |
Abrha H. and Teshome G., “Reliability Assessment of Electrical Distribution Network using Analytical Method: A Case Study of Maychew City Distribution System”, International Journal of Engineering Research & Technology (IJERT), 9(08): 977-985, 2020.
|
| [3] |
Anteneh D., “Reliability Assessment of Distribution System Using Analytical Method: A Case Study of Debre Berhan Distribution Network”, Journal of Informatics Electrical and Electronics Engineering, 1(1): 1-9, 2020.
https://doi.org/10.54060/JIEEE/001.01.002
|
| [4] |
M. Wadi, M. Baysal, A. Shobole, and M. R. Tur, “Historical and Monte Carlo Simulation-Based Reliability Assessment of Power Distribution Systems”, Sigma Journal of Engineering and Natural Sciences, 38(3): 1527-1540, 2020.
|
| [5] |
Sultan, R. A. Swief and M. M. Mostafa, “Optimal DG Placement in a Radial Distribution Network for Reliability Improvement”, Journal of Al Azhar University Engineering Sector, 12(45): 1351-1358, 2017.
|
| [6] |
Abdulfeta M., “Reliability Assessment of Distribution System and Improvement by Intelligent Placement of Distributed Generation (DG): Case Study of Gonder City Power Distribution System” Master’s Thesis, Bahir Dar University, Bahir Dar, Ethiopia, 2020.
|
| [7] |
Huynh Tien Dat, Nguyen Thi Bich, Nguyen Ngoc Phuc and Le Quang Binh, “Distribution Network Reliability Assessment by ETAP Software”, Greater Mekong Subregion Academic and Research Network (MSARN) International Journal, 16: 33-46, 2022.
|
| [8] |
Hamza A. “Assessment of Electric Power Distribution Feeder Reliability: Case Study of Adama City Feeders Before and After Rehabilitation” Master’s Thesis, Adama Science and Technology University, Adama, Ethiopia, 2020.
|
| [9] |
Shaoyun Ge, Li Xu, Hong Liu, Mingxin Zhao, "Reliability Assessment of Active Distribution System Using Monte Carlo Simulation Method", Journal of Applied Mathematics, vol. 2014, Article ID 421347, 10 pages, 2014.
|
| [10] |
Khaidir A, Rama O, and Ramadoni S, “Reliability Analysis of Power Distribution System”, Journal of Electrical Technology UMY (JET-UMY), 1(2), 2017.
|
| [11] |
S. L. Braide and E. O. Kenneth, “Improved Reliability Analysis of Electricity Power Supply to Port Harcourt Distribution Network”, International Journal of Engineering Science Invention, 7(7): 2319–6734, 2018,
https://doi.org/10.15662/ijareeie.2022.1105001
|
| [12] |
Dikio C. Idoniboyeobu, Biobele A. Wokoma and Noble C. Adiele, “Improvement of Electrical Power Reliability for Afam Community in Rivers State, Nigeria”, American Journal of Engineering Research (AJER), 7(5): 162-167, 2018.
|
| [13] |
Balogun M. O., Ahmed M. O., Ajani A. A., and Olaoye H., “Reliability Assessment of 33 KV Feeder: A Case Study of Transmission Company of Nigeria, Ganmo Work Centre” World Journal of Innovative Research, 6(1): 77-83, 2019. Available online at:
https://www.wjir.org/download_data/WJIR0601016.pdf
|
| [14] |
Ghiasi M., Ghadimi N. and E. Ahmadinia, “An analytical methodology for reliability assessment and failure analysis in distributed power system”, Springer Nature Applied Sciences Journal, 1(44), 2018,
https://doi.org/10.1007/s42452-018-0049-0
|
| [15] |
Kabi Raj Puri, Ash Bahadur Subba, Kezang Pelden, and Roshan Chhetri, “Reliability Assessment of Distribution System through Cost Analysis”, International Journal of Scientific Research and Engineering Development, 3(4): 560-565, 2020.
|
| [16] |
IEEE Guide for Electric Power Distribution Reliability Indices," in IEEE Std 1366-2012 (Revision of IEEE Std 1366-2003), vol., no., pp. 1-43, 31 May 2012,
|
| [17] |
E-TAP, “E-TAP user Guidelines”, South California: Operation Technology, Inc, 2016.
|
| [18] |
Eyasu B, “Studies on Power Distribution System Reliability Assessment and improvement”, Master’s thesis, Addis Ababa Science and Technology University, Addis Ababa, Ethiopia, 2017.
|
| [19] |
Getinet U., “Reliability Assessment and its Improvement of Power Distribution systems: Case Study of Dire Dawa Substation I”, Master’s thesis, Adama Science and Technology University, Adama, Ethiopia, 2020.
|
Cite This Article
-
APA Style
Adem, A., Kumar, R., Abubeker, W. (2025). Reliability Assessment of Haramaya University Power Distribution System. American Journal of Electrical Power and Energy Systems, 14(1), 1-10. https://doi.org/10.11648/j.epes.20251401.11
 Copy
|
Copy
|
 Download
ACS Style
Adem, A.; Kumar, R.; Abubeker, W. Reliability Assessment of Haramaya University Power Distribution System. Am. J. Electr. Power Energy Syst. 2025, 14(1), 1-10. doi: 10.11648/j.epes.20251401.11
Copy
|
Download
AMA Style
Adem A, Kumar R, Abubeker W. Reliability Assessment of Haramaya University Power Distribution System. Am J Electr Power Energy Syst. 2025;14(1):1-10. doi: 10.11648/j.epes.20251401.11
Copy
|
Download
-
@article{10.11648/j.epes.20251401.11,
  author = {Abdulaziz Adem and Ramesh Kumar and Wehib Abubeker},
  title = {Reliability Assessment of Haramaya University Power Distribution System},
  journal = {American Journal of Electrical Power and Energy Systems},
  volume = {14},
  number = {1},
  pages = {1-10},
  doi = {10.11648/j.epes.20251401.11},
  url = {https://doi.org/10.11648/j.epes.20251401.11},
  eprint = {https://article.sciencepublishinggroup.com/pdf/10.11648.j.epes.20251401.11},
  abstract = {This study looks at how reliable Haramaya University's electricity distribution system is and offers ways to make it better. The main causes of the current system's severe reliability problems are overload, tree contact, wind, aged poles and equipment, cable failure, and poor maintenance and operation practices. In this study, six cases were simulated using ETAP 19.0.1 software to represent Haramaya University's current and future distribution systems. The reliability indicators of the current system are under Ethiopian standards, according to the results. In Case 5 (underground ring distribution network), the reliability indices improved significantly with shorter interruption durations, less interruptions per customer per year, and an increased availability index. Ethiopian Electric Utility (EEU) lost an estimated 2,585,743.99 Ethiopian Birr (ETB) in revenue as a result of power outages. In Case 5, Haramaya University (HU) could save 5,762,746.38 ETB annually and the utility could save 2,239,549.9 ETB annually. To increase distribution system reliability, the study recommends converting an overhead radial network to an underground ring network, integrating solar distributed generators, and placing fuses and reclosers in distribution lines. Another way to increase reliability until the underground ring distribution system is finished is to replace outdated equipment and cut trees.},
 year = {2025}
}
Copy
|
Download
-
TY  - JOUR
T1  - Reliability Assessment of Haramaya University Power Distribution System
AU  - Abdulaziz Adem
AU  - Ramesh Kumar
AU  - Wehib Abubeker
Y1  - 2025/02/10
PY  - 2025
N1  - https://doi.org/10.11648/j.epes.20251401.11
DO  - 10.11648/j.epes.20251401.11
T2  - American Journal of Electrical Power and Energy Systems
JF  - American Journal of Electrical Power and Energy Systems
JO  - American Journal of Electrical Power and Energy Systems
SP  - 1
EP  - 10
PB  - Science Publishing Group
SN  - 2326-9200
UR  - https://doi.org/10.11648/j.epes.20251401.11
AB  - This study looks at how reliable Haramaya University's electricity distribution system is and offers ways to make it better. The main causes of the current system's severe reliability problems are overload, tree contact, wind, aged poles and equipment, cable failure, and poor maintenance and operation practices. In this study, six cases were simulated using ETAP 19.0.1 software to represent Haramaya University's current and future distribution systems. The reliability indicators of the current system are under Ethiopian standards, according to the results. In Case 5 (underground ring distribution network), the reliability indices improved significantly with shorter interruption durations, less interruptions per customer per year, and an increased availability index. Ethiopian Electric Utility (EEU) lost an estimated 2,585,743.99 Ethiopian Birr (ETB) in revenue as a result of power outages. In Case 5, Haramaya University (HU) could save 5,762,746.38 ETB annually and the utility could save 2,239,549.9 ETB annually. To increase distribution system reliability, the study recommends converting an overhead radial network to an underground ring network, integrating solar distributed generators, and placing fuses and reclosers in distribution lines. Another way to increase reliability until the underground ring distribution system is finished is to replace outdated equipment and cut trees.
VL  - 14
IS  - 1
ER  -
Copy
|
Download